 Social media marketers, how are you feeling? Take a minute to breathe if you need to. The last few months have been a wild ride. Fatigue, vertigo, and even a little nausea are perfectly understandable. As I said before, social media isn’t dying, but it is changing. Marketers are used to quick changes, naturally, but it’s important to be sure we’re making the right changes. We should approach evolving our social media with the same data-driven, strategic rigor that applies to everything else we do. The good folks at Rival IQ recently published their 2018 Social Media Benchmarking Report. The data points to some clear directions for the next evolution of social media marketing. Here are some of the key data points – and, more importantly, what you should do about them.
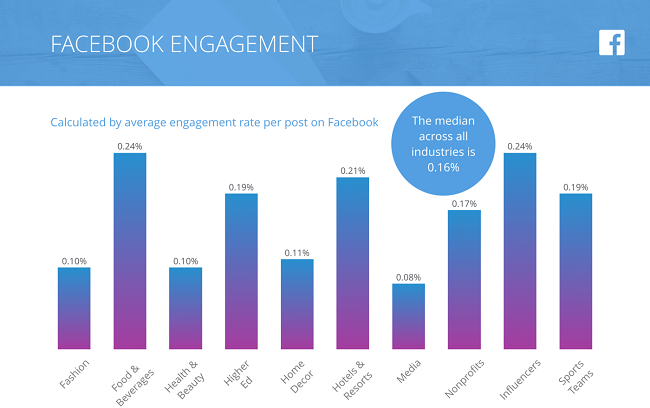
#1 - Influencers Have the Highest Engagement Rate on Facebook
 The report breaks down engagement by platform and by vertical, which invites some intriguing comparisons. If you’re in the food & beverage industry, congratulations! You’re likely seeing some of the highest engagement. If you’re not, however, there’s no need to roll out a new Cloud-Based SaaS brand of soft drink. Influencers are also hitting the top engagement rate (a whopping .24%, but more on that later).
What to Do:
TopRank Marketing has been talking about influencer marketing since before it was cool. These stats underline the importance of co-creating content with influencers who are relevant to your audience. It’s incredibly tough for brands to make a connection with organic social. Influencers can provide the person-to-person relationship that most people want out of social media interaction. Read: Death of Facebook Organic Reach = New Opportunities for Influencer Marketing#2 - More Posting Doesn’t Equal More Engagement
The highest post frequency on Facebook is in the Media vertical, with an average of over 10 posts per day. That’s an artifact of an old way of thinking about social media: Flood your page with posts and hope one or two stick. That strategy doesn’t seem to work anymore. Media has the lowest engagement rate, at .08%. Especially with Facebook, upping your posting frequency is counterproductive. The algorithm will show your posts in fewer feeds, fewer people will interact with them as a result, and you start a vicious cycle that ends up slashing your organic reach.What to Do:
Stick to one or two posts per day, and really make them count. That’s right at the industry average, and seems to be the threshold on most platforms for how much an audience wants to see branded content. If you have ten potential posts, get ruthless: Pick the two that are most interesting, most relevant, most valuable to your audience. Then save the rest for a roundup blog post at the end of the week.#3 - Engagement Rates Vary Widely by Platform
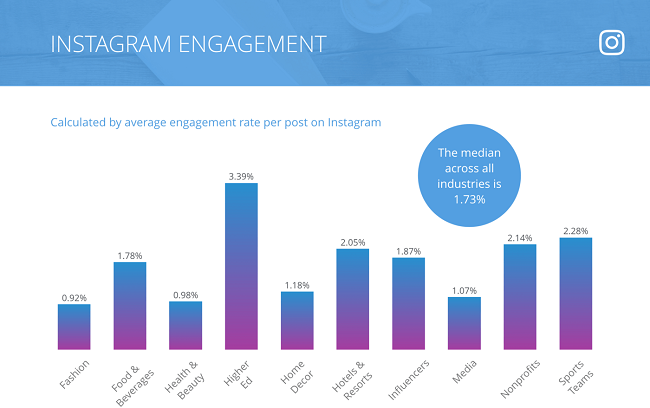
We tend to talk about social media as though it were a single monolithic platform. Of course we know there are differences between channels, but the report underscores just how much they can vary. The engagement rates for Instagram are above the 1% mark, with some verticals seeing over 3%:
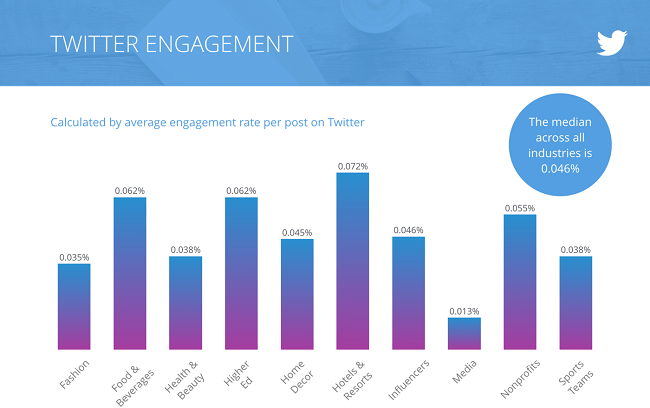
 While Twitter has an average engagement of .046%. That’s 4 hundredths of a percent, or engagement on one out of every 4,000 posts.
What to Do:
If Instagram fits your brand, and your audience is there, these stats are definitely an endorsement for hopping on the 'gramwagon. But don’t count Twitter out completely. There is a great deal more content posted on Twitter than Instagram, and Twitter moves a lot faster. So that low engagement rate shouldn’t scare you off completely. Instead, use Twitter to boost your brand awareness, provide customer service via social media monitoring, and to engage with potential influencers. Paid posts on Twitter can also have a powerful impact. One of our technology clients initially ruled out Twitter completely. We were able to prove they had a potential audience on Twitter and helped them run a paid program. In the end, their Twitter engagement was far higher than engagement on any other platform.#4 - Engagement Is Low on Every Platform
More than anything, the report shows just how low the benchmarks are across the social media spectrum. If an email marketing campaign had a .046% average open rate, we would be throwing in the towel writing our resignations at the same time. The drop in engagement makes sense, though, with how social media platforms have evolved. They used to be based on delivering all the posts the user opted into seeing. Whatever accounts the person chose to follow, that was what filled their feed. Now every major social site is curated by algorithm. The user doesn’t control what they see, and neither do brands.What to Do:
There are two key ways to thrive in the Age of the Algorithm. We’ve already covered the first: Start thinking of most of these channels as pay-to-play. Take your most compelling content and throw some paid promotion behind it on your highest-performing platform. Then A/B test your audience targeting until you find the sweet spot. The second is to produce the type of content that the algorithm will promote. For Facebook and Twitter, that increasingly means native video. Facebook in particular has been explicit about their favoritism for video. Posts that match what the platform wants to promote will get a bigger initial push, which can help you get engagement, which will signal the algorithm to promote it more. It’s also a good idea to explore the major platform that’s missing from Rival IQ’s report: LinkedIn*. The reported engagement rate on LinkedIn is .054%, lower than Facebook but higher than Twitter. However, it’s easy to more than double that benchmark with a little optimization, as this infographic from LinkedIn shows. You can also branch out on LinkedIn by having your C-suite post their own thought leadership content on their own accounts. Personal posts are likely to get more engagement and more shares.Stay on Your Mark and Don’t Get Benched
Social media marketing is still one of the newest marketing disciplines there is. We’re still developing best practices as the platforms continue to evolve. It’s a little like trying to build a train while you’re going 60 miles per hour down a track built on top of a pool of lime Jell-O. These benchmarks can provide a starting point for the next iteration of your strategy. They might not speak to your specific vertical or audience, but they do highlight the broad changes taking place across social media. To make sure your train keeps rolling, focus on just a few high-quality posts per day, boosted with paid ads on your most valuable channels. Need help mastering social media marketing? Here’s how we helped one company expand their reach. *LinkedIn is a TopRank Marketing Client.The post Social Media Marketing Benchmarks: What Works & Where to Focus appeared first on Online Marketing Blog - TopRank®.
No comments:
Post a Comment